Formatting Data for the Decision Tree Generator

In my last post I explained a bit about what needs to be passed to the decision tree generator’s constructor function, but I didn’t go into detail about how to get the numbers into the formats specified. Luckily it’s very easy! I have included a function in the decision tree generator sketch which will take a properly formatted text file and and automatically turn it into the column array of integers that you need. Also in the example sketch folder I have included some such text files as examples. Essentially you will need one text file each for the output array and for each of your attributes. The text file should be formatted to contain only the number 0 through however many levels that particular attribute or output can take on. Each number should be on its own line and the file should contain no punctuation. This may sound tedious to make, but Microsoft Excel, Matlab and many other free spreadsheet programs can save a column of numbers in just such a format by saving the file as a .txt or .csv. The text file just needs to be placed in the same folder as the Processing .pde file (the sketch itself) and it should be good to go. Now you should be ready to follow this example and make your decision tree! The example shows generically how to load the output, three attributes and then create their labels and variables. The variable and text file names can obviously re-named to anything you may want.

  //*****************
  // Load a text file with separate values (just an integer number) on each line
  // the text file is converted to an integer array which can be input to the decision tree generator

  int[] output = loadData("outputs.txt");
  int[] attribute0 = loadData("attribute0.txt");
  int[] attribute1 = loadData("attribute1.txt");
  int[] attribute2 = loadData("attribute2.txt");

  //******************
  // OUTPUT Information
  String[] output_labels = {"out_label1", "out_label2"};

  // INPUT #0 / Attribute 0
  int num_attribute0_levels = 3;   // 0 = level0, 1 = level1, 2 = level2
  String[] attribute0_labels = {"level0", "level1", "level2"};

  // INPUT #1 / Attribute 1
  int num_attribute1_levels = 2;   // 0 = false, 1 = true
  String[] attribute1_labels = {"false", "true"};

  // INPUT #2 / Attribute 2
  int num_attribute2_levels = 4;  // 0 = low, 1 = med, 2 = high
  String[] attribute2_labels = {"Low", "Med", "High"};

  // INPUT Information
  int[][] input_attributes = {attribute0, attribute1, attribute2};
  String[] attribute_labels = {"Attribute_0", "Attribute_1", "Attribute_2"};
  String[][] attribute_level_labels = {attribute1_labels, attribute2_labels, attribute3_labels};
  Decision_Tree tree;
  int leave_out = 2;
  int[] node = {1, 1};
  float screen_width = width;

How to Use the Decision Tree Generator

For the longest time I have simply been showing outputs from my decision tree generator and telling you all the things it is capable of doing, but I haven’t given you access to it or shown you the code itself. For the most part this is because the code is ugly and some may say hacked, but since I am not a professionally trained software engineer, I don’t care too much. I am a roboticist who is interested in writing software and designing systems to allow people (especially those with little experience) to enjoy robots and machine learning, more so than making optimally efficient software. My code is fully commented (maybe even overly so) in the hopes that someone looking at it in the future won’t have trouble understanding what it does (or how to make it better). The code is being hosted on my Bitbucket account and there is a link to the code on my software page.

A brief explanation of how to use the generator should start with explaining that the decision tree generator is essentially a single Java Class object and the only function the user is required to interact with is the constructor for the class. The constructor for a Class is the function/method in the object oriented programming Class which initializes an object (an instance) of that Class. Meaning the constructor builds you one of the things you want. All you have to do is pass the constructor some inputs. The decision tree generator constructor is relatively large and looks like this:

// CONSTRUCTOR //
  Decision_Tree(String tree_name, int[] outputs, String[] output_labels, int[][] attributes, String[] attribute_labels, String[][] attribute_level_labels, int leave_out, int[] initial_node, float screen_width)

Yes, there are a lot of inputs to this single function, but since it is the only one you need to use to generate the decision tree and Arduino code, it really isn’t all that bad. Plus, I’ll explain what each input is and how to make it.

(String tree_name) should be the name of the decision tree you are making, such as “play_tennis”. Make sure this name contains no spaces or punctuation except underscore, “_”, characters.

(int[] outputs) should be be an integer array representing the output label/class for each input/output pair. This integer array should have an element for each input/output pair, it should contain only numbers ranging from 0 to the number of possible output classes. If your data is something like “no”/”yes” or “left”/”right”/”center” simply replace each label with an integer so that no = 0, yes = 1 or left = 0, right = 1 and center = 2. This array may look something like int[] outputs = {0, 1, 1, 0, 1, 1, 1, 1, 0, 1, 0, 0, 1, 0};

(String[] output_labels) should be an array of String objects, where each element represents the actual label for the corresponding output level/class. For example we just learned that the outputs should be integers from 0 to the number of output classes so the number of labels should be equal to the number of classes as well. For example: String[] output_labels = {“no”, “yes”} or String[] output_labels = {“left”, “right”, “center”};

(int[][] attributes) might be little more confusing because it is an array of integer arrays, but if you think about it as a matrix or a spreadsheet it shouldn’t be too difficult to understand. Each column of the matrix/spreadsheet of attributes represents a different attribute, for example: int[][] attributes = {outlook, humidity, temperature, wind}. Each one of these columns is just like the outputs array we already learned about. The column arrays for all the attributes must be the same length (have the same number of elements) and each one must only contain numbers from 0 to the number of levels that specific attribute can take on. The length of all the columns must be the same as the outputs array because the decision tree algorithm expects to see input/output pairs, where the entry for all the attributes is the input and the output entry is obviously the output.

(String[][] attribute_level_labels) is very similar to the attributes matrix, except that the length of the columns are simply equal to the number of different levels for that given attribute. For example: we could have String[] attribute1_labels = {“hot”, “mild”, “cold”} and String[][] attribute2_labels = {“cloudy”, “sunny”}. Then String[][] attribute_level_labels = {attribute1_labels, attribuite2_labels}. We need to have a label for each possible value of a given attribute and an array of labels for each of the attributes.

(int leave_out) is simply the number of input/output pairs that we have passed to the constructor that we do not want to use to generate the decision tree. In general it is always a good idea to partition your data into test and validation sets randomly and then use the percent accuracy of the validation set to determine how well the tree generated from the training set will generalize to new instances. If the number leave_out is greater than 0 then this is the number of pairs at the end of the output and attribute columns which will be ignored during tree generation. The validation data will be output in the command line in a format for use on the Arduino for validation.

(int[] initial_node) is used to help generate the graphical tree and the auto-generated code. This should always be passed int[] initial_node = {1, 1}.

(float screen_width) is used to determine the size of the graphical output. Processing has a global constant called width which should be passed for this value.

I’ll go into more detail explaining exactly how to generate some of this data without having to manually enter it all by hand in my next post.

Validation of System to Date

Now comes the moment you’ve all been waiting for. The moment when I actually explain how I intend to test my system and verify that it works as I designed. All machine learning and data analysis systems which attempt classification must be vetted by measuring their percent accuracy at classifying some aptly named “test set” after being trained on some equally well named “training set”. By set we simply mean some vectors of input attributes with their associated output labels/classes/decisions. In general it is simple for a machine learning system to be good at classifying the data it is trained on (because it has seen those examples during the training phase), but it is more difficult (and more beneficial) for the system to have high accuracy at inferring the proper classification for inputs that it has not seen before. Because decision trees specifically use labeled data for training (meaning they require both input vectors and output labels), by simply partitioning the data set into a training portion and test portion it is possible to test the accuracy of the system by comparing the systems recommended decisions for the test set to the actual output labels.

To validate my system I have used two relatively small data sets so far. The popular “play tennis data set” from Tom Mitchell’s book “Machine Learning”, and the ubiquitous (in the world of machine learning) Fisher’s Iris Data Set. The play tennis data set consists of 16 days worth of data, where each day records the outlook (overcast, sunny, rainy), temperature (hot, mild, cool), humidity (high, normal), wind (weak, strong) and the result of play tennis (yes, no). This data was randomly ordered and two days were held back from training to be used for validation. This processes of randomly mixing the days then selecting two for validation occurred seven times. Each time the 14 training days were used to build the decision tree and then the two validation days were run through the decision tree function on the Arduino three times each. Each generated tree was used three times to see the effects of the random decision on some undetermined nodes. The result: 78.6% accurate classification.

The Iris Data Set was a bit different to implement simply because its attributes (sepal length, sepal width, petal length and petal width) are all measured on a continuous scale. Because the decision tree program as currently written can only handle discrete attributes I first had to essentially histogram the attributes into discrete levels/bins. I used a scatter plot of the binned data to somewhat arbitrarily choose eight bins, or eight levels for each of the four attributes. In future, modifications to the decision tree program to handle continuous data would be useful, however for now simply comparing percent accuracy on the test set can be used to verify the number of discrete levels chosen. With the discrete data I built ten decision trees each using a random 90% of the data set (135 data vectors) and tested the remaining random 10% (15 data vectors) on the implemented decision tree in the Arduino three times on each generated tree. The result: 94.4% accurate classification.

Following these tests I attempted to get a sense of how well the tree program could generalize if it was built using less training data. I attempted building trees using random samples of the 150 data vectors of size 100, 75, 50 and 25 vectors. Then I ran each tree on the remainder of the 150 data vectors for validation. The results:

# of Vectors to Build Tree | # of Vectors Tested | % Correct
100                                             50                         94.5%
75                                               75                         93.1%
50                                             100                         90.2%
25                                             125                         80.9%

In the future I hope to test additional data sets with more data points and potentially adapt the decision tree to handle continuous data as well as discrete data. Below is the Arduino code used to implement the validation of one of the generated decision trees.

#include <play_tennis.h>

int output_tennis[]  = {0, 0};
int outlook[]  = {2, 2};
int temp[]  = {2, 2};
int humidity[]  = {0, 1};
int wind[]  = {1, 0};

void setup() {
  Serial.begin(9600);

  int correct_count = 0;
  int wrong_count = 0;
  for (int i = 0; i < 2; i++) {
    int decision = play_tennis(outlook[i], temp[i], humidity[i], wind[i], analogRead(0));
    if(decision == output_tennis[i]){
      correct_count++;
    }
    else{
      wrong_count++;
    }
    Serial.print("Decision = ");
    Serial.print(decision);
    Serial.print(" | Answer = ");
    Serial.println(output_tennis[i]);
  }
    Serial.print("\nCorrect = ");
    Serial.print(correct_count);
    Serial.print(" | Wrong = ");
    Serial.println(wrong_count);
}

void loop(){
}

Auto-generated Arduino Code and Randomness

I am aware that I haven’t posted anything new for a few days now, and that is simply because I’ve been making too much progress to slow down and write about what’s going on. All in all the auto-generated code portion is essentially complete. I have added some functionality to allow the generated code to also include comments  which make the if/else  branch structure nearly as easy to read and follow as the graphical tree generated in Processing. The idea is for future students to make trees by hand and compare their work to the generated code, or to simply take the generated code and write about how and why it works or to possibly implement a task with an Arduino that will require a decision tree to make choices. The comments amount to explaining what the numbers correspond to in the if/else branches and what the decisions are and why.

In addition to adding commenting to the the auto-generated code I decided to also add the random number generation that was occurring in Processing to the Arduino code. In general the decision tree attempts to traverse down a given branch gaining information the whole time and reducing entropy to zero, at which point there is only one option left, the decision. However, it is possible for a decision branch to check all the attributes and still be unsure (not yet at zero entropy). If this occurs my decision tree randomly chooses a leaf node to place on the end of the branch (if there were no training examples on this branch) or else randomly chooses a weighted leaf node to place on the branch (if there were training examples on this branch). What this means is, if a branch has never occurred in training then the decision is randomly made (because there is not enough data to make an inference), and it should be correct 1/n*100% of the time, where n is the total number of possible decisions. However, if there were examples on that branch then the random choice is weighted in favor of examples that have occurred more often. For example if in training there were examples for a given non-zero entropy branch of a, a, b then the decision a should be chosen twice as often as decision b.

I have chosen to allow non-zero entropy random branches to exist in my decision tree implementation because in general some randomness can be desirable in mobile robots and other applications with noisy data that can be prone to local minima. For this reason I have chosen to move the random decision generation to the Arduino. If the random choice was made in Processing then for the duration the tree is loaded on the Ardunio the same decision will always be made for that branch. With the random number generation on the Arduino it has the ability to make different decisions each time an undetermined condition occurs. Further testing will be necessary to determine if this design choice is valid. For now I will leave you with some of the generated code with comments and random number generation included.

/* play_tennis decision Tree file for Arduino	*/
/* Date: 20 Feb 2012					*/
/* Time: 14:50:24						*/

#ifndef play_tennis_H
#define play_tennis_H

#if defined(ARDUINO) && ARDUINO >= 100
#include "Arduino.h"
#else
#include "WProgram.h"
#endif

// 	Output (Decision):
// play_tennis	levels: 0 = No 1 = Yes
// 	Input (Attributes):
// Outlook	levels: 0 = Overcast 1 = Rain 2 = Sunny
// Temp	levels: 0 = Cool 1 = Mild 2 = Hot
// Humidity	levels: 0 = Normal 1 = High
// Wind	levels: 0 = Weak 1 = Strong

int play_tennis(int Outlook, int Temp, int Humidity, int Wind, int random_seed){
	randomSeed(random_seed); // seed the psuedo random number generator
	if(Outlook == 0){	// Outlook == Overcast?
		return 1;	// play_tennis = Yes
	}
	else if(Outlook == 1){	// Outlook == Rain?
		if(Wind == 0){	// Wind == Weak?
			return 1;	// play_tennis = Yes
		}
		else if(Wind == 1){	// Wind == Strong?
			return 0;	// play_tennis = No
		}
	}
	else if(Outlook == 2){	// Outlook == Sunny?
		if(Humidity == 0){	// Humidity == Normal?
			if(Temp == 0){	// Temp == Cool?
				return 1;	// play_tennis = Yes
			}
			else if(Temp == 1){	// Temp == Mild?
				return 1;	// play_tennis = Yes
			}
			else if(Temp == 2){	// Temp == Hot?
				if(Wind == 0){	// Wind == Weak?
					return random(2);	// play_tennis = random choice
				}
				else if(Wind == 1){	// Wind == Strong?
					int random_choices[] = {0, 1};
					return random_choices[random(2)]; // play_tennis = weighted random choice
				}
			}
		}
		else if(Humidity == 1){	// Humidity == High?
			return 0;	// play_tennis = No
		}
	}
}

#endif

Auto-generated Arduino Code: Day 1

So the moment I’ve been working toward for the past few weeks has arrived. I’ve finally started the process of having my decision tree program in Processing output generated code that can be run on the Arduino platform. In this first day I’ve made a huge amount of progress, going from nothing to having all the necessary code generated to create a function which can be run on the Arduino. What I’ve done is allow the decision tree program in processing to create a .h header file with the name of the tree as the name of the generated function. The inputs to the function are integer variables whose names are the names of the attributes used to create the tree. The auto-generated code includes comments which tell the name of the function and the date and time it was generated. Once the .h file is generated, all I have to do is use the decision tree function with the Arduino is place the generated “tree_name”.h file in the Arduino libraries folder and then add #include <“tree_name”.h> to my Arduino sketch. From there on the decision tree function will simply take in integer inputs for the attributes and output the decision as an integer which is the output level. I’ll be working to clean up all my code and examples and to run some data sets through the system for verification and to determine percent accuracy. For now I’ll leave you with some of the auto-generated code and the decision tree diagram that goes with it.

/* tennis decision Tree file for Arduino	*/
/* Date: 13 Feb 2012                        */
/* Time: 18:22:33                           */

#ifndef tennis_H
#define tennis_H

#if defined(ARDUINO) && ARDUINO >= 100
#include "Arduino.h"
#else
#include "WProgram.h"
#endif

int tennis(int Outlook, int Temp, int Humidity, int Wind){
	if(Outlook == 0){
		return 1;
	}
	else if(Outlook == 1){
		if(Wind == 0){
			return 1;
		}
		else if(Wind == 1){
			return 0;
		}
	}
	else if(Outlook == 2){
		if(Humidity == 0){
			if(Temp == 0){
				return 1;
			}
			else if(Temp == 1){
				return 1;
			}
			else if(Temp == 2){
				if(Wind == 0){
					return 0;
				}
				else if(Wind == 1){
					return 1;
				}
			}
		}
		else if(Humidity == 1){
			return 0;
		}
	}
}

#endif

Tennis Decision Tree

Basic Graphics for Decision Trees

As I’ve continued to work towards making my decision tree program capable of auto-generating Arduino code, I’ve realized that it would be helpful to get a visual sense of what the decision tree structure looks like. By producing some graphical representation of the decision tree I thought I would get a better understanding of how I would generate the program control structure, and where in my program to generate the if/else branches. I have learned a couple of things, first that it is difficult for a recursive structure to keep track of where in the structure it currently is, and also that Processing is very adept at making simple graphical output. In summary, I was able to use the pushMatrix() and popMatrix() functions, which are part of Processing, to save my current coordinate system on a stack before each recursive branch. This would allow each branch to behave identically to the larger tree. Also I used a very clever, at least I think it’s clever, method of storing my current node location in terms of the level number, and the branch number. This allows the tree to make decisions about how to represent and space the branches on a given node given the depth and number of other nodes at that level. Here are a couple of teaser images of the graphical output.

decision tree graphic 2decision tree graphic 1Now that I have some basic (very basic) graphical output to represent the tree structure, I should be ready to begin the process of using the graphical tree structure to create actual Arduino code.

Loading Data into Processing

For the past couple of days I have been doing my best to use other data that has been collected and analyzed with commercial software, like Matlab, to verify if my decision tree program is working. One common data set that is often used is something called the Fisher’s Iris Data. This data set is useful because it has been analyzed with many different algorithms and methods over the years and also because it is the example set used in the Matlab Statistics Toolbox Classification Tutorial. I will go further into how I used this data set to test my decision tree in an upcoming post. One problem with using a data set like Fisher’s Iris Data is that there are over a hundred data points for each of several factors; these take a long time to type into an array, as is required by my basic decision tree program. In Matlab a simple command like “load fisheriris” is all that is needed to load the whole data set into a collection of arrays. I wanted to find a way to do something similar with my program that would allow data to be collected and manipulated in Excel or Matlab or a simple text editor and then loaded directly into the program. There are surely multiple ways to handle this problem but I’ve got a simple solution that uses a combination of the Processing function loadString() as well as a simple method to convert arrays of Strings to arrays of Integers as described on  Manikandan’s Weblog. Enjoy the example:


// Each Processing Sketch requires a setup() and draw() function, this is the setup()
void setup()
{
  // Basic Processing setup codes
  size(640, 360);           // Create window of size 640 by 360 pixels
  background(0);            // Make window background color black
  stroke(255);              // Make stroke (line) color white
  noLoop();                 // Don't repeat (loop) the draw() fucntion

  // Load a text file with separate values (just an integer number) on each line
  // into an array of Strings, which each value in its own String
  // 100.txt contains the number 1 to 100, each on its own line
  String[] dataString = loadStrings("100.txt");
  // Print how many lines the file contained
  println("there are " + dataString.length + " lines");
  for (int i=0; i < dataString.length; i++) {
    // Print each line or number String
    println(dataString[i]);
  }
  println();             // Add a blank line to the command line ouput

  // Use custom function convertStringArraytoIntArray to convert each
  //String in an array of Strings to an integer in an array of integers
  int[] dataIntArray = convertStringArraytoIntArray(dataString);
  // Print how many numbers are in the array
  println("there are " + dataIntArray.length + " numbers in array");
  for (int i=0; i < dataIntArray.length; i++) {
    // Print each number in the array
    println(dataIntArray[i]);
  }
  println();             // Add a blank line to the comand line output
}

// Each Processing Sketch requires a setup() and draw() function
// We're not using the draw function, so we leave it blank
void draw()
{
}

// Custom Function that takes an array of Strings
// and returns an array of integers
public int[] convertStringArraytoIntArray(String[] sarray) {
  // If the array of Strings is not empty or NULL then process it
  if (sarray != null) {
    int intarray[] = new int[sarray.length];
    // Create int array with elements for each String in String array
    for (int i = 0; i < sarray.length; i++) {
      // For each String in String array, use parseInt to get integer
      intarray[i] = Integer.parseInt(sarray[i]);
    }
    return intarray;      // Return the interger array
  }
  return null;            // If the String array was null, return null
}

Decision Tree Recursion Begins

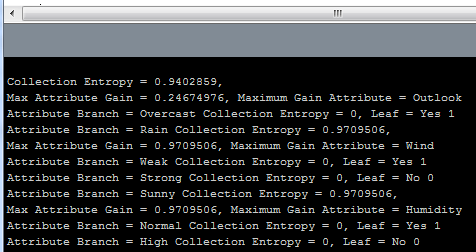
So today the decision tree took its first gasping and labored breath and lived! What I mean, is that today I finished all the basic guts to make the implementation of my algorithm recursive. (If you don’t know what recursion try searching google for recursion). Recursion is the handy and sometime mind-bending ability of a computer program function, method or object to call/invoke itself from within itself! This ability is very useful because often times an operation that needs to be performed on one block of data is the same as that which is necessary to be performed on each sub-block of data. Therefore the function keeps calling itself until it gets down to the smallest sub-block of code it can process, then after it finishes the next block up the chain uses its results and so on, until the whole thing is wrapped back up at the top. Inherently decision trees (and just about any sort of software tree structure, and even some real trees) can be recursive, because their branches are basically just smaller trees themselves. The decision tree algorithm makes smaller decision trees using recursion until it finds a node with 0 entropy  (which means the outcome is totally determined at that node) called a leaf. In such a way a single object, Decision Tree, can build itself from the leaf nodes back up to the trunk or root node. So far my tree has no fancy output or graphical display and is not commented or ready for public viewing, but as I clean it up and get it interacting with the Arduino I’ll post the polished source. For now here’s a teaser of the command line debug feedback showing the tree at work.

Decision Tree example Command Line Output
Processing Command Line Output Showing Entropy, Information Gain and Leaf Nodes of Decision Tree

More Decision Trees in Processing

This is going to have to be a short post because I’m simply out of time for the day.

I’ve been doing some reading about information theory as the basis for using entropy and information gain as measures to choose the branches and leaves of a decision tree. I’ve also been reading other people’s implementations of decision tree algorithms, so I won’t be totally reinventing the wheel with this project. First off, a very good general explanation of decision trees can be found at Rudjer Boskovic Institute’s Data Mining Server tutorial titled Decision Trees. In the tutorial is J. Ross Quinlan’s classic decision tree algorithm ID3.

function ID3
Input:   (R: a set of non-target attributes,
          C: the target attribute,
          S: a training set) returns a decision tree;
begin    If S is empty, return a single node with
      value Failure;
   If S consists of records all with the same
      value for the target attribute,
      return a single leaf node with that value;
   If R is empty, then return a single node
      with the value of the most frequent of the
      values of the target attribute that are
      found in records of S; [in that case
      there may be be errors, examples
      that will be improperly classified];
   Let A be the attribute with largest
      Gain(A,S) among attributes in R;
   Let {aj| j=1,2, .., m} be the values of
      attribute A;
   Let {Sj| j=1,2, .., m} be the subsets of
      S consisting respectively of records
      with value aj for A;
   Return a tree with root labeled A and arcs
      labeled a1, a2, .., am going respectively
      to the trees (ID3(R-{A}, C, S1), ID3(R-{A}, C, S2),
      .....,ID3(R-{A}, C, Sm);
   Recursively apply ID3 to subsets {Sj| j=1,2, .., m}
      until they are empty
end

I’m doing my best to implement something similar to this in Processing, we’ll see how it goes. So far I am able to calculate the entropy and gain of a collection and all it’s attributes, but have not yet written the code to branch the attributes and outputs in order to recursively traverse the tree. If this doesn’t prove too difficult I’d also like to make graphical output to demonstrate the structure of the tree and possibly post-prune the tree as recommended by experts to remove over-fitted branches that reduce the decision tree’s ability to generalize to data outside the training set.

Speech Recognition and Decision Trees in Processing

So, I’ve been hard at work, sometimes so much so that I have neglected to update and record my progress.

Today I spent some time trying to discover the capabilities of the ER1’s speech recognition system. This proved to be quite a bit more difficult than I originally thought. First of all, the speech recognition system which is built into the Robot Control Center (RCC) requires the use of a microphone (obviously) which I did not have on hand. Once I located an adequate microphone and had it configured and adjusted to function with the Windows XP ER1 laptop I realized that the RCC speech recognition function is an extension of the operating system’s speech recognition engine (which was not installed on the ER1 laptop). Thankfully by locating an ancient Microsoft Office XP install disk I was able to install and setup the speech recognition engine and do some of the training examples to improve the recognition. When the system was finally running and functional in the OS, I was able to run the RCC speech recognition behavior with good results. I had the ER1 listen for me to say the phrase “Good Morning” at which point it responded by saying “I just heard you say ‘Good Morning'”. It was pretty satisfying to have the robot hear my voice and respond, I must say. However, there seems to be no functionality (at least no documented functionality) to allow the speech recognition system in the RCC to be controlled or interface through the telnet interface which I am currently using to autonomously control the ER1. This speech recognition problem may be reviewed in the future.

Now to the exciting stuff. Working on the machine learning algorithms. I spent the last couple of days working to write some general decision tree building functions in Matlab, with some success, but lots of frustration. In general a decision tree is a type of regression that uses statistical weights for different inputs to choose a final output class. Troubleshooting guides are a basic type of decision tree that attempt to locate the source of a technical problem. In my system I am attempting to take a labeled collection of inputs and outputs and build a decision tree in Processing that can be implemented on an Arduino. The heavy lifting of calculating all the statistical weights and information gains  make sense to be implemented in Processing because a PC is much more powerful than an Arduino. Then the Arduino (which can be part of a robot, electronic art installation or anything else someone may create) can benefit from the use of the decision tree to make it smarter (I hope).

The design so far is as follows: Input (arbitrary number of attributes (like temperature or humidity) which can each take on some unique arbitrary number of discrete levels (like hot, cool, cold) with all levels represented by integers 1 to n, where n is the number of levels that attribute has. Output (arbitrary number of output states/classes (like yes/no or left/right/center) with all output states also represented by integers 1 to n, where n is the number of output classifications. The data used to train/build the tree must be some collection of ordered sets of attributes and output classes, where a greater number of training data has the potential to build a more accurate tree. A couple of relatively simple equations are used to calculate the values needed to build the tree.

The entropy represents how much variability/randomness a particular attribute contains. An entropy value of 1 means that the attribute has no effect on the output. An entropy value of 0 is deterministic, and leads to a single decision (output classification) and thereby determines when a branch of the tree will end in a terminal leaf. The gain value determines the information gain a given attribute provides based on the current branch it is on. The gain values are used to determine the branch nodes and hierarchy of the tree. The “i” above represents the possible output states and the “v” represents the possible values an attribute can take on.

So far in Processing I have an architecture for the tree and functions to calculate entropy and gain, but the difficult task of making the entire thing recursive and adaptable to arbitrary data sets, and producing some output that is usable by the Arduino is still to be done.